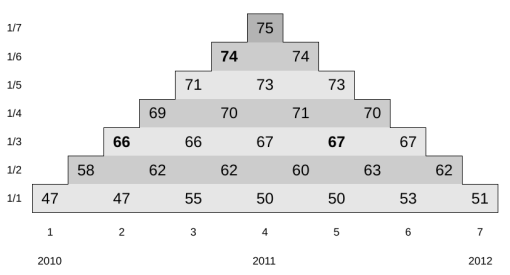
With the help of a combined data set over seven referendum votes for the years 2010 (3 dates), 2011 (3 dates) and 2012 (1 date) it was possible to follow the turnout of individual voters in the City of St. Gallen over time. Average turnout rates for the seven individual referendum votes do not look surprising. They are actually rather high for Swiss standards and range from 44.5% to 53.4%.
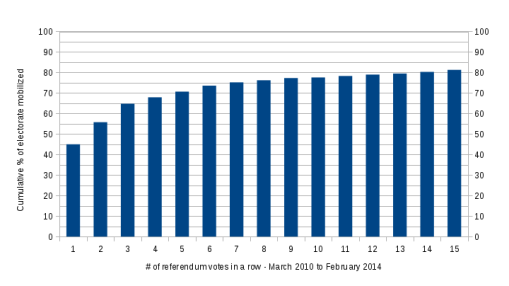
Taking note of how many voters participated at least once across all seven votes we can see that the cumulative participation rate climbs up to 75.3% within a time span of only two years. It could very well go up to 80% for a whole legislature, not yet including elections. 75.3% of the electorate in the City of St. Gallen have therefore participated in at least one polling day out of seven. These figures hardly mirror the picture of an apathetic electorate or of a largely silent majority. As we can see in the table below cumulative turnout already crosses the 50% mark for each consecutive pair of polling dates, which means that within only six months more than half of the electorate was mobilized for a formal political event. The annual values for the years 2010 and 2011 amount to 66.1% and 66.6%, respectively.
More can be found here in German:
Serdült, Uwe (2013) Partizipation als Norm und Artefakt in der schweizerischen Abstimmungsdemokratie – Entmystifizierung der durchschnittlichen Stimmbeteiligung anhand von Stimmregisterdaten aus der Stadt St. Gallen, in: Andrea Good und Bettina Platipodis (Hrsg.) Direkte Demokratie: Herausforderungen zwischen Politik und Recht. Festschrift für Andreas Auer zum 65. Geburtstag. Bern, Stämpfli Verlag, 41-50.
or here in English:
Serdült, Uwe (2014) Switzerland, in: Qvortrup, Matt (Ed.) Referendums around the World: The Continued Growth of Direct Democracy. Basingstoke: Palgrave Macmillan.